Note
Go to the end to download the full example code.
Multioutput PCovC#
import numpy as np
import matplotlib.pyplot as plt

from sklearn.datasets import load_digits
from sklearn.preprocessing import StandardScaler
from sklearn.decomposition import PCA
from sklearn.linear_model import LogisticRegressionCV
from sklearn.multioutput import MultiOutputClassifier

from skmatter.decomposition import PCovC

plt.rcParams["image.cmap"] = "tab10"
plt.rcParams["scatter.edgecolors"] = "k"
For this, we will use the sklearn.datasets.load_digits dataset. This dataset contains 8x8 images of handwritten digits (0-9).
X, y = load_digits(return_X_y=True)
x_scaler = StandardScaler()
X_scaled = StandardScaler().fit_transform(X)

np.unique(y)
array([0, 1, 2, 3, 4, 5, 6, 7, 8, 9])
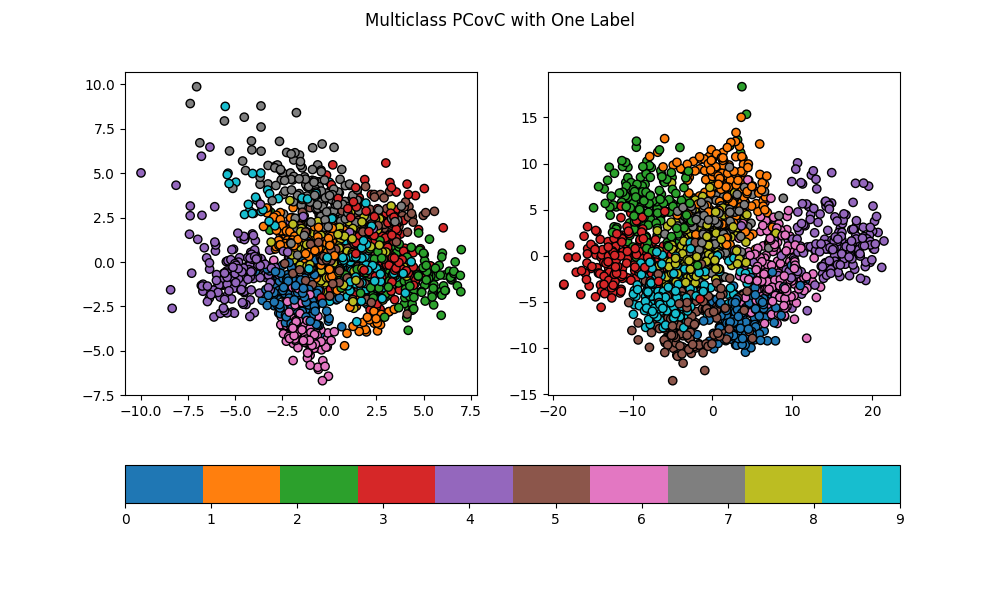
Let’s begin by trying to make a PCovC map to separate the digits. This is a one-label, ten-class classification problem.
pca = PCA(n_components=2)
T_pca = pca.fit_transform(X_scaled, y)

pcovc = PCovC(n_components=2, mixing=0.5)
T_pcovc = pcovc.fit_transform(X_scaled, y)

fig, axs = plt.subplots(1, 2, figsize=(10, 6))

scat_pca = axs[0].scatter(T_pca[:, 0], T_pca[:, 1], c=y)
scat_pcovc = axs[1].scatter(T_pcovc[:, 0], T_pcovc[:, 1], c=y)
fig.colorbar(scat_pca, ax=axs, orientation="horizontal")
fig.suptitle("Multiclass PCovC with One Label")
/home/docs/checkouts/readthedocs.org/user_builds/scikit-matter/envs/267/lib/python3.13/site-packages/sklearn/linear_model/_logistic.py:473: ConvergenceWarning: lbfgs failed to converge after 100 iteration(s) (status=1):
STOP: TOTAL NO. OF ITERATIONS REACHED LIMIT

Increase the number of iterations to improve the convergence (max_iter=100).
You might also want to scale the data as shown in:
    https://scikit-learn.org/stable/modules/preprocessing.html
Please also refer to the documentation for alternative solver options:
    https://scikit-learn.org/stable/modules/linear_model.html#logistic-regression
  n_iter_i = _check_optimize_result(

Text(0.5, 0.98, 'Multiclass PCovC with One Label')
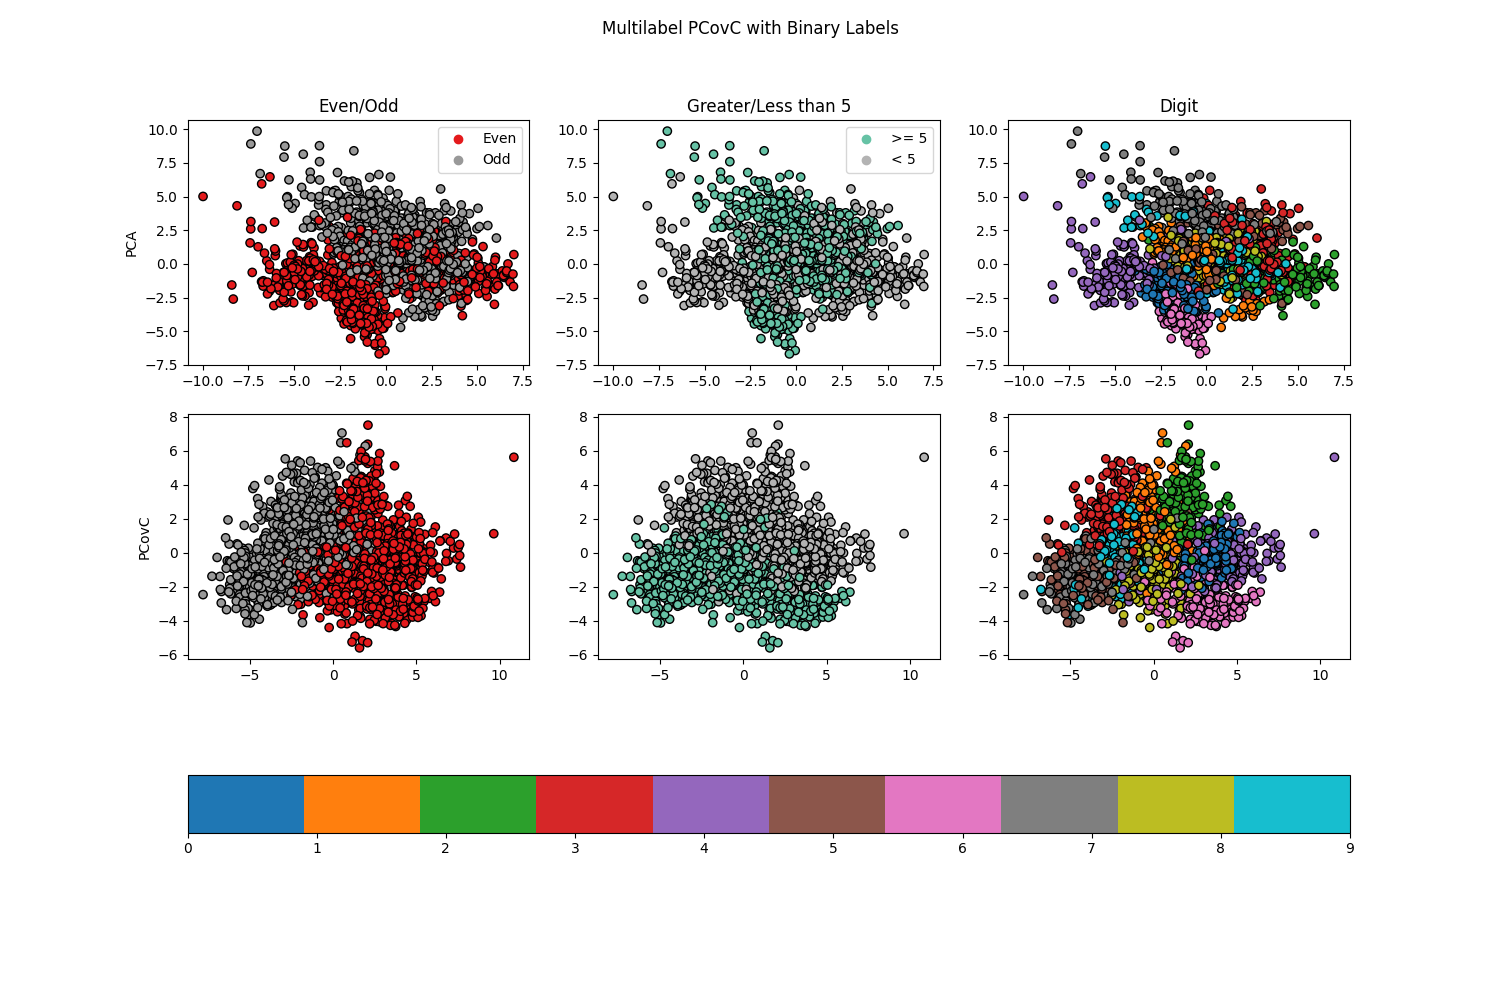
Next, let’s try a two-label classification problem, with both labels being binary classification tasks.
is_even = (y % 2).reshape(-1, 1)
is_less_than_five = (y < 5).reshape(-1, 1)

y2 = np.hstack([is_even, is_less_than_five])
y2.shape
(1797, 2)
Here, we can build a map that considers both of these labels simultaneously.
clf = MultiOutputClassifier(estimator=LogisticRegressionCV())
pcovc = PCovC(n_components=2, mixing=0.5, classifier=clf)

T_pcovc = pcovc.fit_transform(X_scaled, y2)

fig, axs = plt.subplots(2, 3, figsize=(15, 10))
cmap1 = "Set1"
cmap2 = "Set2"
cmap3 = "tab10"

labels_list = [["Even", "Odd"], [">= 5", "< 5"]]

for i, c, cmap in zip(range(3), [is_even, is_less_than_five, y], [cmap1, cmap2, cmap3]):
    scat_pca = axs[0, i].scatter(T_pca[:, 0], T_pca[:, 1], c=c, cmap=cmap)
    axs[1, i].scatter(T_pcovc[:, 0], T_pcovc[:, 1], c=c, cmap=cmap)

    if i == 0 or i == 1:
        handles, _ = scat_pca.legend_elements()
        labels = labels_list[i]
        axs[0, i].legend(handles, labels)

axs[0, 0].set_title("Even/Odd")
axs[0, 1].set_title("Greater/Less than 5")
axs[0, 2].set_title("Digit")

axs[0, 0].set_ylabel("PCA")
axs[1, 0].set_ylabel("PCovC")
fig.colorbar(scat_pca, ax=axs, orientation="horizontal")
fig.suptitle("Multilabel PCovC with Binary Labels")
Text(0.5, 0.98, 'Multilabel PCovC with Binary Labels')
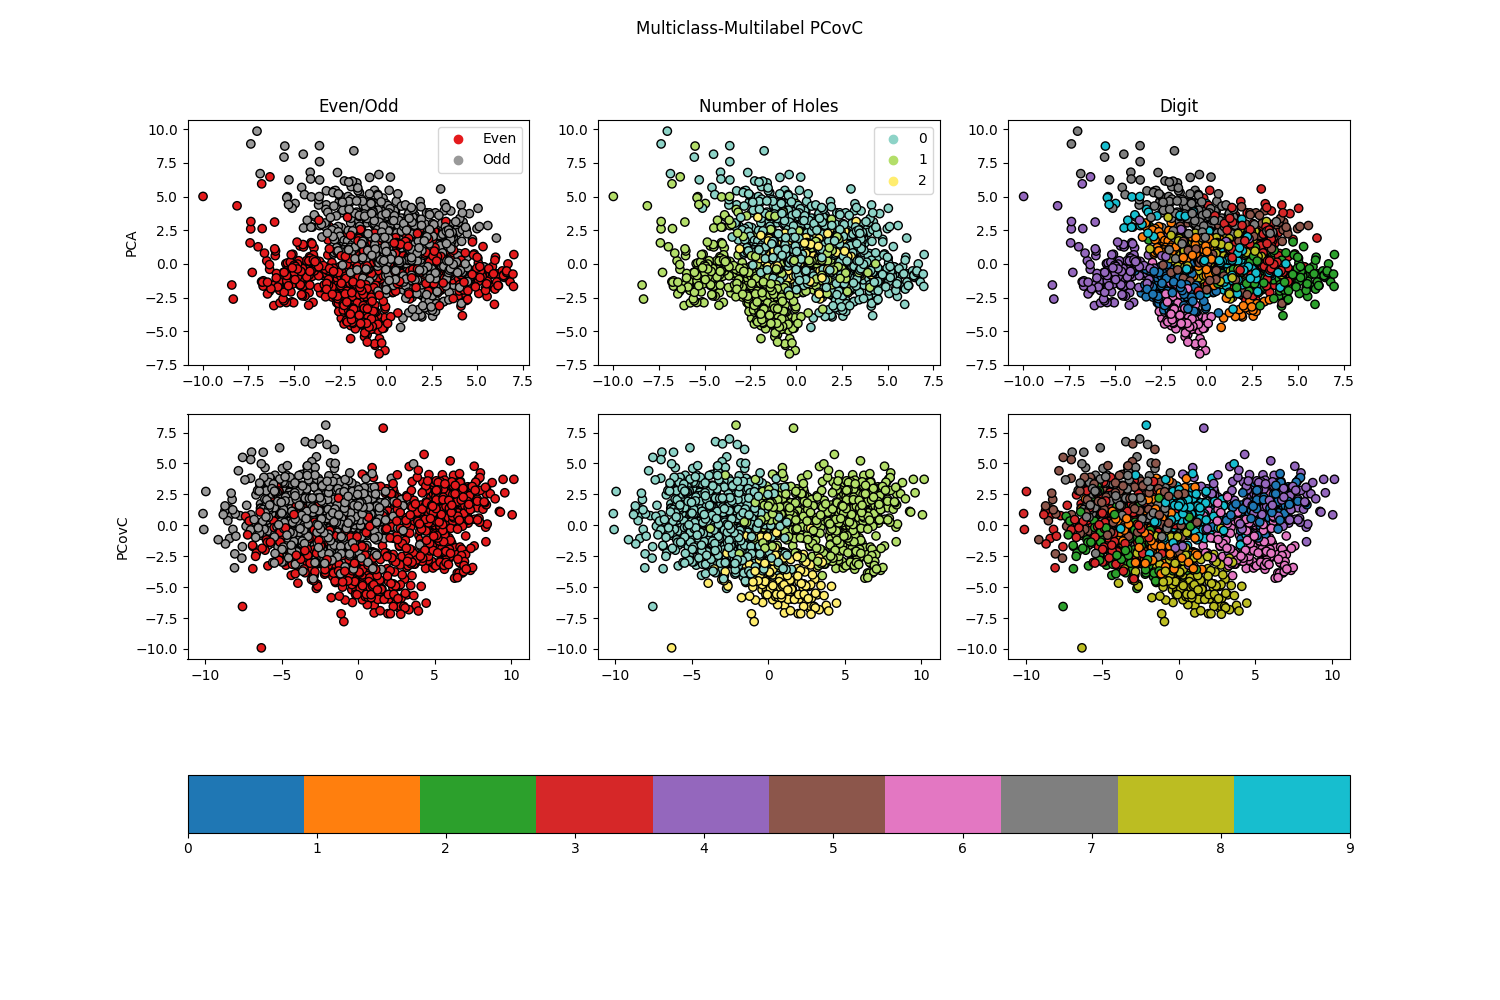
Let’s try a more complicated example:
Now, we have a two-label classification problem, with one binary label and one label with three possible classes.
clf = MultiOutputClassifier(estimator=LogisticRegressionCV())
pcovc = PCovC(n_components=2, mixing=0.5, classifier=clf)

T_pcovc = pcovc.fit_transform(X_scaled, y3)

fig, axs = plt.subplots(2, 3, figsize=(15, 10))
cmap1 = "Set1"
cmap2 = "Set3"
cmap3 = "tab10"

labels_list = [["Even", "Odd"], ["0", "1", "2"]]

for i, c, cmap in zip(range(3), [is_even, num_holes, y], [cmap1, cmap2, cmap3]):
    scat_pca = axs[0, i].scatter(T_pca[:, 0], T_pca[:, 1], c=c, cmap=cmap)
    axs[1, i].scatter(T_pcovc[:, 0], T_pcovc[:, 1], c=c, cmap=cmap)

    if i == 0 or i == 1:
        handles, _ = scat_pca.legend_elements()
        labels = labels_list[i]
        axs[0, i].legend(handles, labels)

axs[0, 0].set_title("Even/Odd")
axs[0, 1].set_title("Number of Holes")
axs[0, 2].set_title("Digit")

axs[0, 0].set_ylabel("PCA")
axs[1, 0].set_ylabel("PCovC")
fig.colorbar(scat_pca, ax=axs, orientation="horizontal")
fig.suptitle("Multiclass-Multilabel PCovC")
Text(0.5, 0.98, 'Multiclass-Multilabel PCovC')